The New AI Paradigm Bubble

Is the AI Boom a New Paradigm...
...or a Dangerous Investing Bubble?

Introduction

Throughout history, market bubbles have followed a distinct and consistent path. From the initial take off and growing media attention to panic and capitulation, every bubble from the Tulip Mania of the 17th Century to the Tech Bubble of the late 1990s has followed a similar trend.

Today’s Artificial Intelligence (AI) boom has followed an almost identical path, as excitement surrounding this new technology has captured everyone’s imagination. However, there are many defining features of the current cycle that have us convinced the AI Paradigm Bubble is swiftly moving past euphoric expectations and is now in dangerous territory… like a bubble about to go “Pop!”

The Anatomy of a Bubble

“The party will go on until reckless speculation becomes unsustainable, ending with the inevitable collapse in bullish sentiment, a phenomenon called a Minsky moment, named for economist Hyman Minsky. It’s what happens when market watchers suddenly begin to wake up and worry about irrational exuberance. Once their sentiment changes, a crash is inevitable as an asset and credit bubble and boom goes into a bust.”

For as long as investors have sought superior returns, markets have oscillated between fear and euphoria. Every new era advocate is convinced that this time is different and eventually rediscovers the mechanics of a bubble.

To better explain this, the economist Hyman Minsky established a five-stage model that outlines the life cycle of financial asset price bubbles. This model –explained below– attempts to add context to one of the most fascinating (and eventually devastating) phenomena in economic and market history.

Stage 1⃣ : Displacement
Displacement occurs when investors get enamored by a new innovation or technology. This first stage becomes a time for discovery as what was initially just an idea, quickly morphs into opportunity. Early adopters experience a genuine structural shift that significantly increases their expectations for profit.

Stage 2⃣ : Boom
As the new paradigm begins to prove itself, investment quickly accelerates. Profits start to rise and so do asset prices as more and more investors enter the market. Capital spending and debt begin to increase, but company balance sheets remain solid and optimism is high but rational.

Stage 3⃣ : Euphoria
During the Euphoria stage asset prices skyrocket as caution is abandoned, expectations for growth become unhinged, and speculators firmly believe growth will be indefinite. Leverage increases exponentially and private credit and off-balance sheet deals become the norm. This not only increases the use of debt, but also hides the true risk from the investing public.
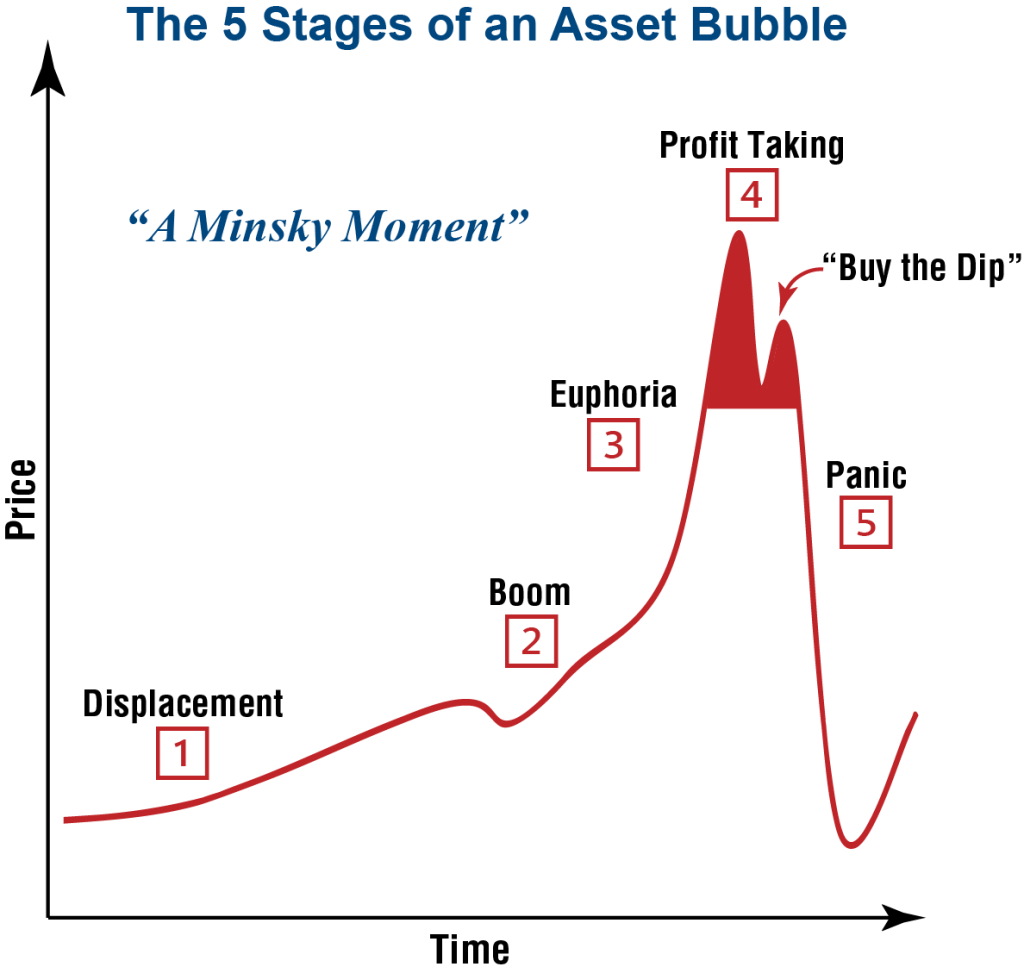
Stage 4⃣ : Profit Taking
At this stage, insiders and risk-managers quietly start selling positions and rotating into safer assets as the warning signs of an outright bubble become apparent. However, this is also one of the most difficult time periods to successfully navigate as speculation remains rampant and the “Buy-the-Dip” mentality can be tough to break. As John Maynard Keynes stated, “the markets can remain irrational longer than you can remain solvent.”

Stage 5⃣ : Panic
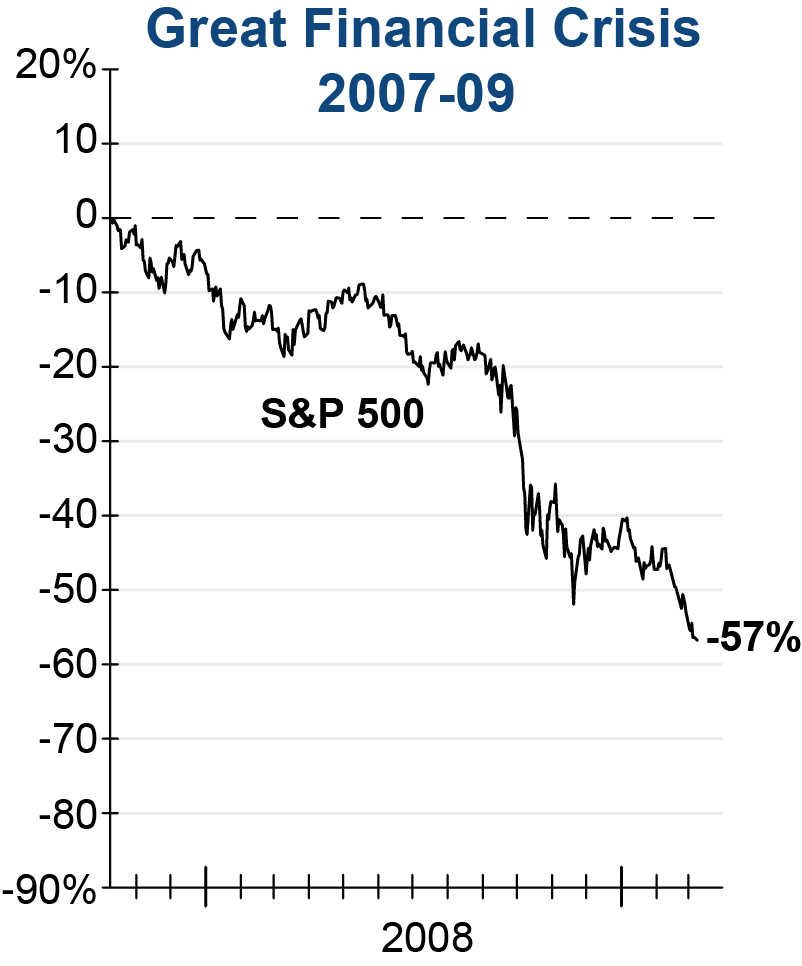
Asset prices fall as rapidly as they ascended during the Euphoria stage of the bubble. Liquidity evaporates and those who believed they could “time the exit” quickly find out how damaging a generational bear market can be. This is also when the risks of leverage and the interconnected nature of hidden debt asserts itself. As Warren Buffett once stated, “only when the tide goes out, do you discover who has been swimming naked.”

Only in the aftermath is an investment cycle formally labeled a “bubble.” While moving through Minsky’s five stages, participants are not acting irrationally. In their own minds, they are responding to rising prices, validating narratives, and seeing apparent proof that the opportunity is real. It is when the cycle breaks that the logic unravels, and the pattern and risk become obvious in hindsight.

Applying this model to today, we are concerned that the market has moved passed Euphoria and now resembles a dangerous environment when near-term Profit Taking can quickly turn into sheer Panic!

The AI Capital Expenditure BOOM

Transformational technologies demand real investment, and artificial intelligence is no exception. What initially began as an insatiable demand for advanced computing chips has rapidly expanded into a far broader build-out that encompasses data centers, networking infrastructure, power generation, and ever-increasing memory capacity. The AI opportunity is no longer theoretical; it needs to be physically constructed at scale.

Worldwide AI Spending Will Total $1.5 Trillion in 2025 – Gartner, 9/17/2025

Tech AI spending may approach $700 billion this year, but the blow to cash raises red flags – CNBC, 2/6/2026

Big Tech’s AI Push Is Costing a Lot More Than the Moon Landing – Wall Street Journal, 2/7/2026

Capital Expenditures (Capex) are investments made by a company to acquire, upgrade, or extend the life of long-term assets. These investments are expected to generate economic benefits over multiple years and typically include property, equipment, infrastructure, or technology. Put simply, Capex is the money a company spends not to run the business today, but to build the business of tomorrow – investments whose payoff is spread over many years.


Aggressive Capex cycles are a natural and often necessary feature of the early stages in any new paradigm. What sets the current AI build-out apart, however, is the breathtaking scale of the spending involved. In fact, as highlighted at left by The Wall Street Journal, expected AI spending from four major Tech companies in 2026 (dark blue bar) ranks second only to the Louisiana Purchase among the largest capital commitments in U.S. history when measured as a percentage of GDP. Furthermore, widely regarded consulting firm McKinsey estimates the cumulative capital outlay needed by 2030 could be a staggering $7 trillion.

The scale of AI capital spending is only part of the story. Equally important is how these investments are being made. Unlike traditional corporate Capex, where spending decisions are largely contained within a single firm’s balance sheet, the AI build-out is deeply interconnected. Chip suppliers are funding customers and sharing revenue, data centers are requiring increased energy and infrastructure, and multi-year supply agreements tie everything together.

As highlighted in the graphic at right, the circular nature of the AI ecosystem has introduced a new dimension of risk. For example, in the fall of 2025 Nvidia announced an agreement to invest up to $100 billion in OpenAI. OpenAI has in turn pre-committed $300 billion to secure long-term computing capacity from Oracle, which will construct and operate data centers filled largely with Nvidia chips. At face value this sounds like an ideal situation, but further analysis shows these are non-binding “agreements” with zero guarantee that the funds will actually change hands.

Bottom line, AI Capex is less a series of isolated investment decisions made by individual companies, and more of a tightly interconnected system that relies on rising levels of spending to sustain momentum. If demand slows, or if the money dries up, the impact is unlikely to be contained. Instead, the whole house of cards just might come crashing down…

Hidden Dangers: Debt, Private Credit, and Off-Balance Sheet Financing

AI enthusiasts are adamant that unlike previous market manias, this one is driven by companies that are profitable and have deep pockets to fund future growth. This argument, however, has quickly shifted with a multi-trillion dollar funding gap emerging between now and the end of the decade as everyone sprints to win the “AI Arms Race.” Initially, companies have accessed credit markets through more standard avenues…

Meta to raise $30 billion in its biggest bond sale as AI expansion costs rack up – Reuters, 10/30/2025

Credit market hit with $200bn ‘flood’ of AI-related issuance – Financial Times, 10/31/2025

The $3 Trillion AI Data Center Build-Out Becomes All-Consuming For Debt Markets – Bloomberg, 2/2/2026

Alphabet Plans Tech’s First 100-Year Bond Since Dot-Com Era – Bloomberg, 2/9/2026

But as the numbers have gotten larger, a more complex playbook is emerging… one that has been at the heart of some of the biggest financial collapses in history – Special Purpose Vehicles (SPVs).

A Special Purpose Vehicle is a separate entity created by a parent company to isolate and manage financial risks. Since the SPV is a distinct company with its own legal status, the structure is commonly used to finance specific projects, execute complex transactions like securitization, and for pooling investments. Inherently, the parent company can keep the SPV’s assets and liabilities separate from its main operations – otherwise known as “off-balance sheet.”

When used correctly, an SPV can allow flexibility and control while isolating financial risk from the parent company. However, as one might suspect, SPV’s lack of transparency has previously led to major market blow-ups…

The Enron Example

In the late 1990s and early 2000s, energy giant Enron increasingly relied on SPVs to move debt and underperforming assets off its balance sheet. These vehicles allowed the company to report lower leverage and stronger cash flows, even as the true financial risks continued to grow. As long as asset values rose and counterparties remained confident, the structure held. Once market conditions turned and confidence eroded, the implicit guarantees embedded in these vehicles were forced back onto Enron’s balance sheet – rapidly and all at once.

Behind Enron’s Fall, a Culture of Secrecy Which Cost the Firm Its Investors’ Trust – Wall Street Journal, 12/5/2001

ENRON’S COLLAPSE; Audacious Climb to Success Ended in a Dizzying Plunge – New York Times, 1/13/2002

What appeared to be dispersed and contained risk revealed itself to be highly concentrated and systemic. Enron instantly became the largest corporate bankruptcy in U.S. history.

The 2008 Great Financial Crisis Example

The widespread use of SPV’s also played a central role in the 2008 financial crisis. Banks and financial institutions pooled mortgages and other loans into SPVs, which then repackaged them as asset-backed securities and collateralized debt obligations for investors. Once again, when the market began to crack this unique structure that was supposed to disperse risk across the financial system, instead actually obscured it. Toxic debt made its way back onto bank balance sheets, forcing fire sales, the bankruptcy of 158 yr old Lehman Brothers, and a collapse in investor/consumer confidence.

The graphic at right shows a simplified version of a recent AI-related deal to build a new $30 billion data center. Both the parent company (Meta) and a Private Equity Firm take joint ownership of a newly created SPV. The SPV issues $27 billion of bonds to fill the funding gap for building the datacenter. But because of the structure of the agreement, this debt is on the SPV’s balance sheet and NOT on Meta’s. Meta will pay rent to use the data center which will go to fund bond interest, principal payments, and dividends to the private-equity firm.

In a unique twist, however, Meta must effectively make lenders whole if they walk away during the early years of the project. So in essence, Meta gets to keep the debt off their balance sheet but is still on the hook if something goes wrong. Auditors are already beginning to get concerned…

Meta Auditor EY Raised Red Flag on Data-Center Accounting – Wall Street Journal, 2/11/2026

The lesson from all of these examples is not that securitization or SPVs are inherently flawed, but that financial engineering cannot eliminate economic risk, only rearrange it. When investment systems are built on shared assumptions, long-dated cash flows, and continuous access to capital, off-balance sheet structures or SPVs can amplify rather than mitigate downturns.

Weighing the Dangers

Artificial intelligence has captured the imagination of investors, inspiring bold forecasts of transformative growth and an equally bold commitment of capital to make those forecasts a reality. History, however, reminds us that such great expectations are often overstated and investors ultimately bear the costs when reality fails to meet the narrative.

The Tech Bubble brought about one of the most transformative inventions in our lifetime, as the internet eventually changed everything we do. Still, this was not enough to curb a 31-month bear market that ultimately triggered an economic recession in 2001. From the S&P 500 peak in March 2000, the S&P 500 Index lost -49% while technology-heavy Nasdaq tumbled -78%.

The Great Financial Crisis of 2007-09 featured a Housing Bubble fueled by easy credit, financial innovation, and the belief that housing could only move higher. What began as a cooling in home prices unraveled into a full-scale credit crisis, triggering the deepest recession since the Great Depression. From peak to trough, the S&P 500 fell over -56%, while major financial stocks lost far more, and trillions of dollars in household wealth evaporated as home prices declined nationwide for the first time in decades.

These examples show how quickly sentiment can change and how the unwind is far swifter and more dramatic than the boom that preceded it. Today, evidence is overwhelming that Wall Street is once again in a bubble as both valuations and expectations have disconnected from reality. In addition, the downside risk is greatly underestimated, as valuations exceed virtually every other time in history. The table at left shows how far today’s stock market could tumble before hitting long-term average valuations. Keep in mind, this is only to reach average valuation levels, not the extreme lows that are typical in most bear markets…

A Safety-First Strategy for Surviving and Profiting in a High-Risk Bubble

“You cannot choose the times in which you invest…
...but you can choose how to invest in the times you are given”

For over 30 years, our respect for risk in the pursuit of profits has been the foundation of our safety-first investment strategy. There are times when this active approach to risk management can leave profits on the table – especially during late-cycle bull markets when investor exuberance can outweigh fundamental concerns. However, environments like today are when our philosophy really pays off. Here are the steps that are essential:

#1 – Avoid and diversify away from the highest-risk segments of the market

Investors’ myopic focus on a very narrow segment of the market has resulted in the S&P 500 becoming more concentrated than any other time in recent history. In fact, the largest 10 stocks account for almost 40% of the Index while Information Technology and mega-cap AI related names account for roughly 50%!

As the chart at left shows, the top 10 holdings on average are extremely expensive and the S&P 500 is significantly overvalued. But there are opportunities in both defensive and value segments of the market. While this significantly increases the risk for the top-heavy Index, it creates an opportunity to seek out areas of the market that have been overlooked.

In fact, SFM portfolios have rarely looked so unlike the S&P 500 Index. Portfolios are well-diversified and intentionally structured to be defensive, resilient, and opportunistic.

#2 – Position for success – take a more stable path to profits

When bubbles unwind and bear markets unfold, there tends to be a distinct shift in sector leadership. Cycle favorites of the last 12 months of a Bull Market, such as Information Technology and Communications, suddenly fall to the bottom and new leadership emerges in Consumer Staples, Energy, Health Care, and Utilities This change happens as investors become less enamored with growth and more focused on stable business models and companies with strong balance sheets and healthy dividends.

No time illustrates this better than the 2000-02 Tech Bubble washout. After the S&P 500 peaked in March of 2000, the Index traded sideways but experienced significant volatility while the Nasdaq quickly fell into bear market territory. Meanwhile, the high-quality S&P 500 Dividend Aristocrats Index benefitted from rotation. This divergence became even more apparent as the bear market picked up steam. The end result was significant losses in both the Nasdaq and S&P 500 Index while those invested in the safety of dividend stocks avoided much of the damage. This reveals that despite the high degree of risk in this market, there can still be opportunities for safe long-term profits.

#3 – Don’t plan on a worst-case scenario, but do allow for one

Most young investors today have little recollection of what it’s like to ride through a bear market, let alone the unwinding of a valuation bubble. It has been 18 years since the last major bear market in 2008 and more than 26 years since the peak of the Tech Bubble.


Since then, “buy-the-dip” has become the average investor’s mantra, reinforced by the rapid recoveries following the 2020 pandemic panic and the 2022 downturn. Long forgotten are the painful lessons of prior cycles, such as waiting over 25 years for Cisco Systems (CSCO) to merely break even after briefly becoming the world’s most valuable company in March of 2000.

Our safety-first strategy does not attempt to completely avoid bear markets. Instead, it aims to survive dangerous conditions in order to thrive in the aftermath of the eventual washout. Our philosophy is to maximize long-term gains in a manner that reduces volatility and emphasizes risk-adjusted returns over the full market cycle. Through disciplined risk management, unique profit opportunities, and selective hedges, SFM portfolios are well positioned to navigate the challenge ahead, and take advantage of the next great buying opportunity when it emerges.

Zach Jonson, CFA
VP & Chief Investment Officer

IMPORTANT DISCLOSURE INFORMATION:
Past performance may not be indicative of future results. Different types of investments involve varying degrees of risk. Therefore, it should not be assumed that future performance of any specific investment or investment strategy (including the investments and/or investment strategies recommended and/or undertaken by Stack Financial Management, Inc. [“SFM”]), will be profitable, equal any historical index or blended index performance level(s), or prove successful. SFM is neither a law firm, nor a certified public accounting firm, and no portion of its services should be construed as legal or accounting advice. Moreover, you should not assume that any discussion or information contained in this document serves as the receipt of, or as a substitute for, personalized investment advice from SFM. A copy of SFM’s current written disclosure brochure discussing its advisory services and fees is available upon request or at www.stackfinancialmanagement.com.

Historical performance results for the investment indexes have been provided for general informational purposes only, and generally do not reflect the deduction of transaction or custodial charges, nor the deduction of an investment management fee, the incurrence of which would have the effect of decreasing historical performance results. Please Note: (1) performance results do not reflect the impact of taxes; (2) account holdings do not correspond directly to any such comparative index; (3) comparative indexes may be more or less volatile than your account; and (4) a description of each comparative index is available upon request.